IoT Data View is a “Data Visualization Dashboard” data display program. Real-Time Visualization, which works with IoT Data Share, shows images of collected data in the desired way. without writing a program
The program can be accessed through a supported web browser, such as Google Chrome, Microsoft Edge, IE 11, etc., to display results by connecting data to the desired display section, such as graphs and labels.
Functions
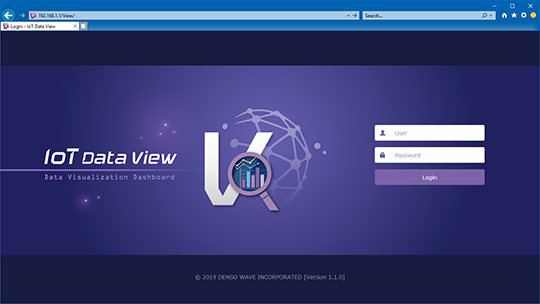
Login screen
Control referable information and executable functions according to the login level.
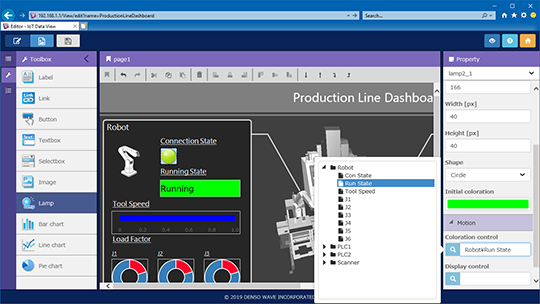
Edit screen
Create dashboard screen instinctively by drag and drop.
- Label: Output data as a text
- Image: Import image and show as background image or output image
- Lamp: Change the color according to the data
- Graph: Output data graph (selectable from bar, line or pie)
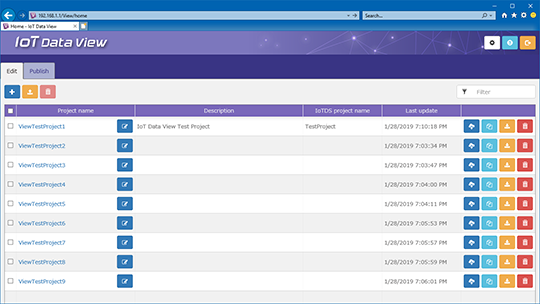
Home screen
Manage the created dashboard in a list.
Dashboard design can be easily shared by using download/upload function.
Published screen
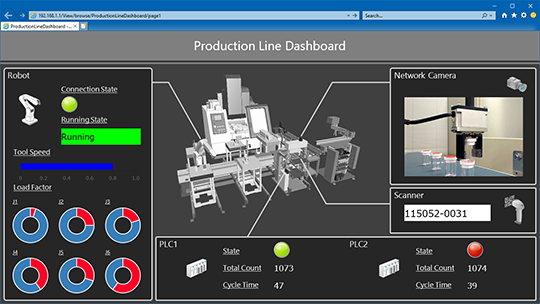
Created dashboard can be displayed on the supported browser.
No additional software installation is required on client PC.